

This article accompanies live DAHL Shorts sessions on this topic. The live sessions are interactive and more focussed on the interests of the participants. Warwick University members can access a recording of the live session.
Categories of application: knowledge management; task management; project management; creative thinking; analytic thinking; teaching; assessment; team management; resource management; collaboration; cloud storage; process modelling.
Difficulty: simple and easy to get started with, advanced applications are worth learning about, but may require expert guidance.
Availability: many free software applications available online; Mindomo is the best I have used (free version available with limitations, various subscriptions from €3 a month for education, teaching version €4.50 a month); Warwick had a license for Mindjet Mindmanager, however this is now being withdrawn due to cost (now minimum £100 per user a year); the Miro collaborative online whiteboard also includes a basic mind mapping template.
Platforms: Mindomo has desktop and mobile versions (Apple and Android), as well as a web browser version. Maps are stored in the cloud, and automatically saved with every edit. The web browser version offers more functionality than the mobile app, except for the ability to dictate topics verbally (mobile only). It is easy to switch between the versions when editing.
Support: Not supported by Warwick IT help desk training, excellent online manual available for Mindomo.
About the techniques and their application
As you can see from the range of “categories of application”, we are looking at a type of application that has a great potential in many different uses. At the same time, it is very easy to use. The power lies in our ability to match features to what we want to achieve in any specific use of it.
The techniques we are dicussing here are not to be confused with the hand-drawn visual thinking approach promoted in the 70s and 80s by Tony Buzan, although the software can be used for that. Buzan’s method is intended to aid memory and creativity through drawing simple and visually engaging maps, using colour and imagery. We know that many students use this approach for revision.
The digital version is more often used to organise (and swiftly reorganise) large amounts of unstructured information. MindomoA sophisticated browser-based application for rapidly recording information and ideas (text, links, images, audio, video, files etc.) and organising it into either a spider-diagram layout with a central topic (mind map) or an interconnected web of topics (concept map). Large amounts of information m... More includes powerful search and query tools, making it a useful research tool (more info below). The alternative term “concept mapping” is sometimes used to distinguish this approach from Buzan’s method. Neither of these terms adequately represents what the software can be used for. Map topics don’t need to be in a person’s mind, they can be the product of multiple people’s research activities. The goal of mapping doesn’t have to be to improve memory. We can use mapping to aid description, analysis, critical evaluation, and creativity. And topics don’t have to be concepts, they can be any kind of information (including dates and locations). Information mapping would be a better term, but mind mapping is most widely used.
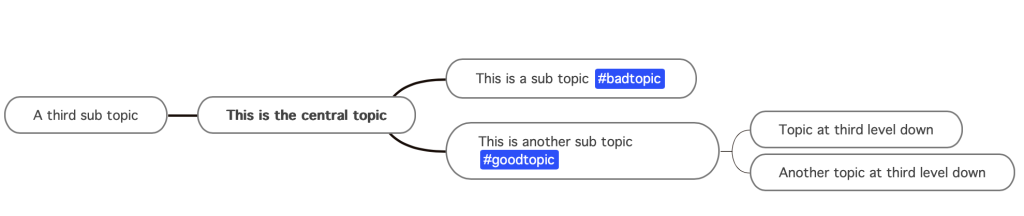
In MindomoA sophisticated browser-based application for rapidly recording information and ideas (text, links, images, audio, video, files etc.) and organising it into either a spider-diagram layout with a central topic (mind map) or an interconnected web of topics (concept map). Large amounts of information m... More the term “mind map” is used to refer to a tree like structure, with a central topic and branches of sub topics.
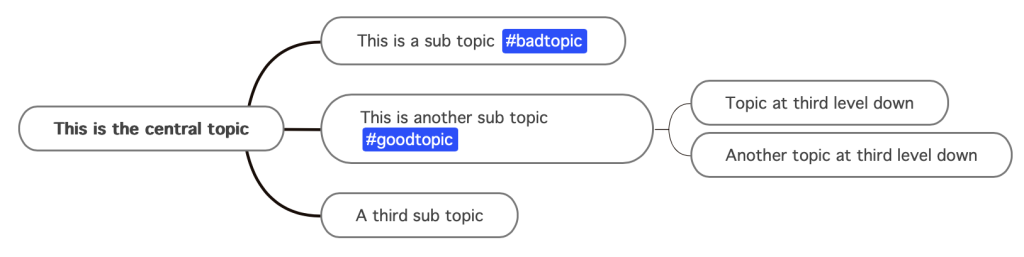
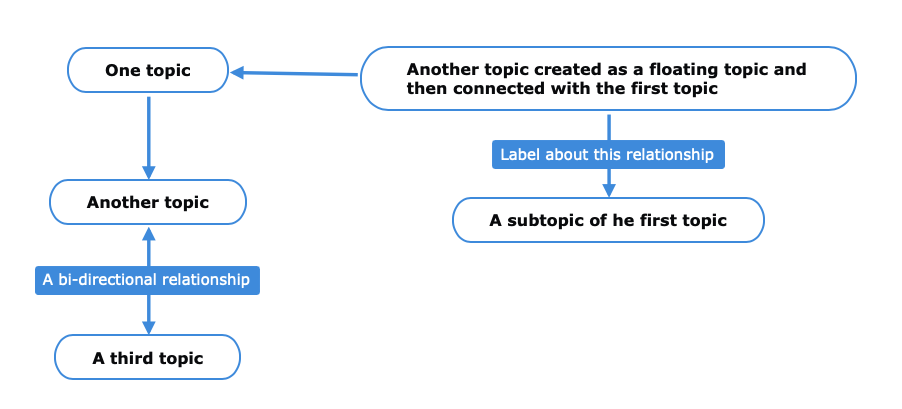
The term “concept map” refers to maps in which topics have multiple connections and there is no central topic. In reality a concept mapA diagram that maps out information and relationships. Information is added to topic nodes, usually as simple titles, with more complete notes, images, links, video, audio etc. attached. Lines connect topics to show relationships. Lines can have arrows to indicate direction (e.g. X topic leads to Y)... More is a mind mapInformation or ideas organised into a tree like structure or "spider diagram", with a central topic and branches of sub topics. Mindomo is a sophisticated but easy to use tool for mind maps and concept maps. More with “floating topics” and connections between them. The connecting lines can have arrows indicating direction and labels explaining what the relationship is.
I have been using, and teaching others to use, mind/concept mapping software for many years. I have known PhD students to use it as their core means for organising their research. It is most useful to me in my work when I know that I have to collect (or generate) large amounts of detailed information on a topic fast, but I’m not sure in advance how I want to organise that information. Whereas with a database the structure has to be created before collecting information, the map allows us to play with structure, organising and reorganising as understanding emerges. It’s then easy to add lots of detailed information (including links, images, video, audio, files), but still be able to focus on the big picture presented by the structure of the map. If we want to work more on a topic at a later date, or assign it to someone else to work on, we can add task information to it.
Good mapping software makes it easy to drag, connect, and rename topics, so that we can quickly change structure. MindomoA sophisticated browser-based application for rapidly recording information and ideas (text, links, images, audio, video, files etc.) and organising it into either a spider-diagram layout with a central topic (mind map) or an interconnected web of topics (concept map). Large amounts of information m... More includes a facility to “play back” the sequence of changes made to a map, so that we can review and reflect on what we have done.
We can also tag topics using an emergent schema, and then search and filter the map based on those tags. This makes mind/concept mapping a powerful analytic tool.
The big advance that has been made in recent years is in the area of collaborative mind/concept mapping. MindomoA sophisticated browser-based application for rapidly recording information and ideas (text, links, images, audio, video, files etc.) and organising it into either a spider-diagram layout with a central topic (mind map) or an interconnected web of topics (concept map). Large amounts of information m... More, for example, includes the ability to share a map online, and to allow others to edit live, so that updates from all users are seen immediately. It can be used synchronously (in live meetings) or asynchronously (with people editing in their own time).
MindomoA sophisticated browser-based application for rapidly recording information and ideas (text, links, images, audio, video, files etc.) and organising it into either a spider-diagram layout with a central topic (mind map) or an interconnected web of topics (concept map). Large amounts of information m... More also provides an educational version for teachers, in which they can create activities for their students (details below).
Examples
Sentiment Analysis tools, by Mirza Rahman.
About Me map used in teaching a postgrad module in Engineering, each student completed one of these before the start of the module.
Web site map, used in project planning and review.
Hands-on detail (using Mindomo)
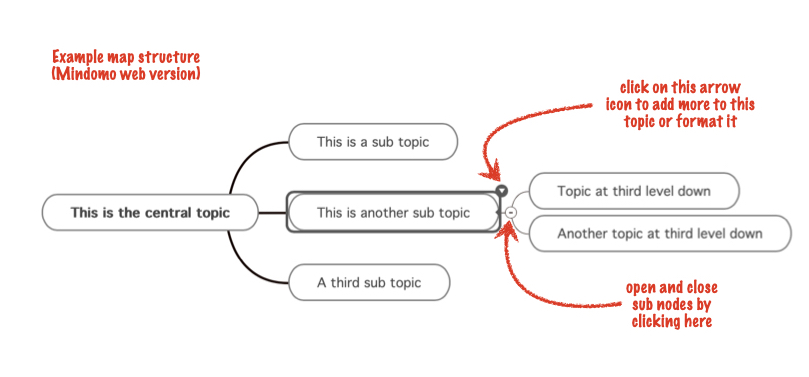
In mind mapping a hierarchical tree-like structure is created, starting with a central topic, and with higher levels in the tree (close to the trunk, or central topic) being more general, and lower levels (branches and braches of branches) going into ever more detail.
The user can hide or show levels of detail, creating different views of a map. Views can be saved as pdf, image, or printed. Use this feature to create views for specific audiences or tasks.
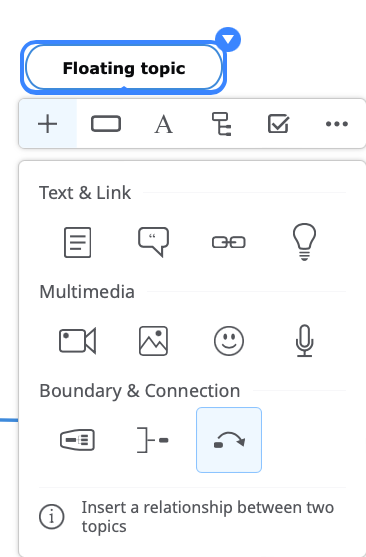
Concept mapping combines multiple trees on a map, arrows indicating direction of flow, and labels to explain the nature of relationships. Add a floating topic by right clicking on blank space. Add and format connecting lines. Edit the labels.
The speed and ease with which new topics can be added is the key to good mind mapping software. Keyboard shortcuts make this quicker.
| Shortcut key | Description |
|---|---|
INS / TAB | Insert a new child topic (subtopic) |
ENTER | Insert a sibling topic below |
SHIFT + ENTER | Insert a sibling topic above |
CTRL + SHIFT + ENTER | Insert a new parent topic |
The MindomoA sophisticated browser-based application for rapidly recording information and ideas (text, links, images, audio, video, files etc.) and organising it into either a spider-diagram layout with a central topic (mind map) or an interconnected web of topics (concept map). Large amounts of information m... More app for mobile devices includes the ability to dictate (speak) new topics into the map.
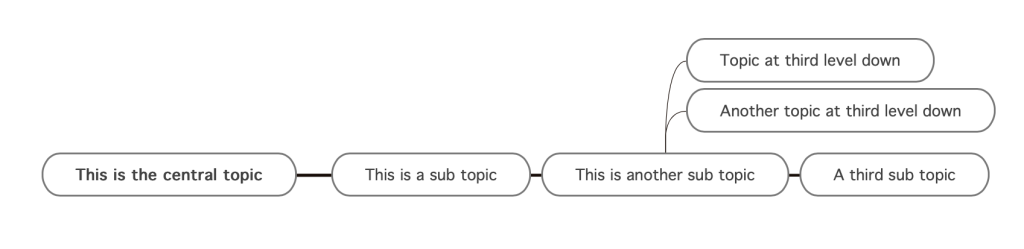
The structure may be displayed in different layouts, for example with topics going from left to right below the central topic.
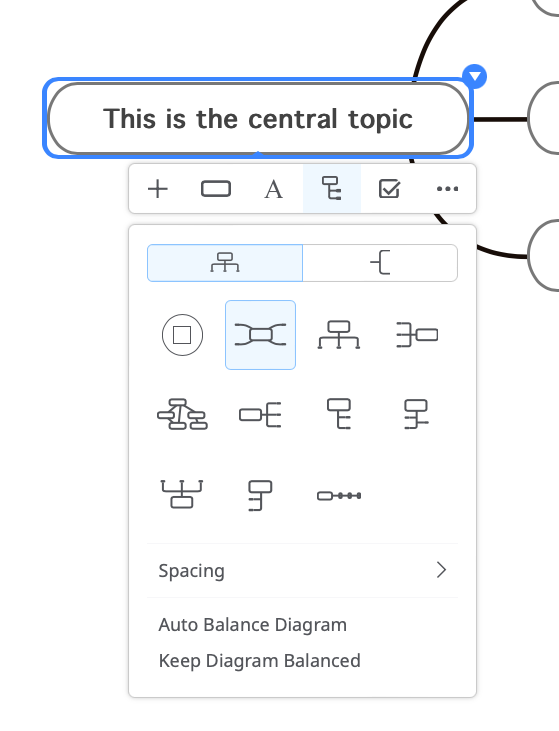
This includes an option to switch from mind mapInformation or ideas organised into a tree like structure or "spider diagram", with a central topic and branches of sub topics. Mindomo is a sophisticated but easy to use tool for mind maps and concept maps. More layout to concept mapA diagram that maps out information and relationships. Information is added to topic nodes, usually as simple titles, with more complete notes, images, links, video, audio etc. attached. Lines connect topics to show relationships. Lines can have arrows to indicate direction (e.g. X topic leads to Y)... More layout with labels.
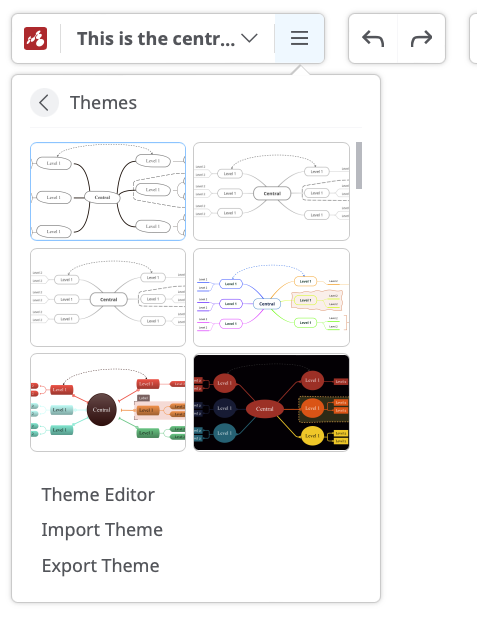
Software usually includes templates for different layouts and themes, including colour schemes, as well as the ability to customise maps and save new themes and template maps.
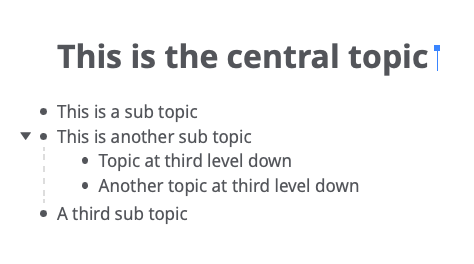
MindomoA sophisticated browser-based application for rapidly recording information and ideas (text, links, images, audio, video, files etc.) and organising it into either a spider-diagram layout with a central topic (mind map) or an interconnected web of topics (concept map). Large amounts of information m... More (web version) also includes the option to display, edit and print the map as a simple list. Some people find this easier to read (outline view).
Some mind mapping software allows for variations on the classic layout, such as the timeline template in MindomoA sophisticated browser-based application for rapidly recording information and ideas (text, links, images, audio, video, files etc.) and organising it into either a spider-diagram layout with a central topic (mind map) or an interconnected web of topics (concept map). Large amounts of information m... More.
We can also have multiple central topics with topic trees in a single map (floating topics), perhaps with connecting lines between them.
Tags are often applied to topics, so that we can classify them across multiple branches. In MindomoA sophisticated browser-based application for rapidly recording information and ideas (text, links, images, audio, video, files etc.) and organising it into either a spider-diagram layout with a central topic (mind map) or an interconnected web of topics (concept map). Large amounts of information m... More add a tag by typing it into the topic text, for example type #goodtopic
In MindomoA sophisticated browser-based application for rapidly recording information and ideas (text, links, images, audio, video, files etc.) and organising it into either a spider-diagram layout with a central topic (mind map) or an interconnected web of topics (concept map). Large amounts of information m... More search we can find or filter topics using a sophisticated query toolset. This provides powerful analysis tools for researchers. Type your query into the search box, and select either “search” (highlight topics that match) or “filter” (hides topics that don’t match). We can search and filter using tags and text.
| Operator | Search results |
|---|---|
marketing plan | Show all topics, comments, or notes containing both “marketing” and “plan” in any order |
"marketing plan" | Show all topics, comments, or notes containing the exact phrase “marketing plan” |
marketing OR plan | Show all topics, comments, or notes containing either “marketing” or “plan” (or both) |
marketing -plan | Show all topics, comments, or notes containing either “marketing” but not “plan” |
created:me marketing | Show all topics, comments, or notes created by me that contain “marketing” |
tasks:all -meeting | Show all tasks that don’t contain “meeting” |
due:week priority:1 | Show all tasks that are due this week (and are not closed) with priority 1 |
start:all assigned:me | Show all tasks that are already started (and are not closed) assigned to me |
due:today tasks:closed | Show all tasks that are due today and are already closed |
We can add a range of topic types, including links, images, videos, audio and files.
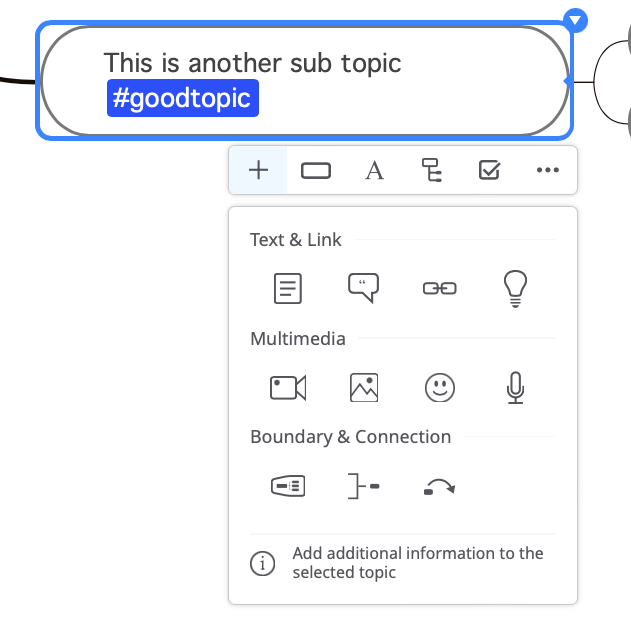
Audio may be recorded directly into a map. Videos can be uploaded or embedded from Youtube or Vimeo.
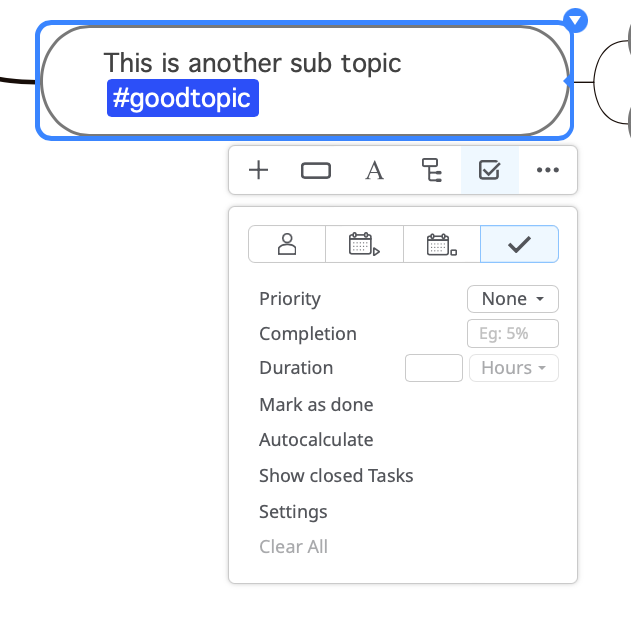
Many mind mapping tools like MindomoA sophisticated browser-based application for rapidly recording information and ideas (text, links, images, audio, video, files etc.) and organising it into either a spider-diagram layout with a central topic (mind map) or an interconnected web of topics (concept map). Large amounts of information m... More, include task management. Add task information to any topic (due date, event date, assigned to MindomoA sophisticated browser-based application for rapidly recording information and ideas (text, links, images, audio, video, files etc.) and organising it into either a spider-diagram layout with a central topic (mind map) or an interconnected web of topics (concept map). Large amounts of information m... More user, priority, progress, duration etc). We can search and filter based on task properties.
MindomoA sophisticated browser-based application for rapidly recording information and ideas (text, links, images, audio, video, files etc.) and organising it into either a spider-diagram layout with a central topic (mind map) or an interconnected web of topics (concept map). Large amounts of information m... More users can also search across all of the maps that they own or have edit rights to. This includes the ability to see all of the tasks that have been assigned to them in any maps (use the search tool on the maps list page, and search for “assigned:me tasks:open”).
Maps can be exported in a range of formats for different applications, such as Microsoft Excel.
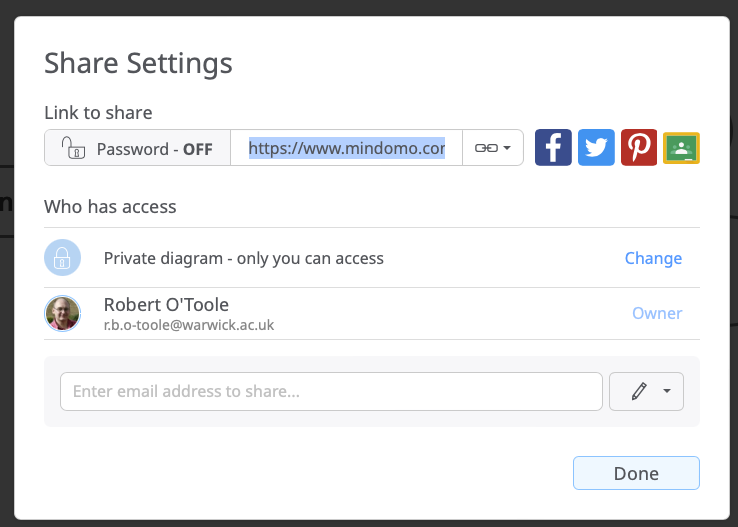
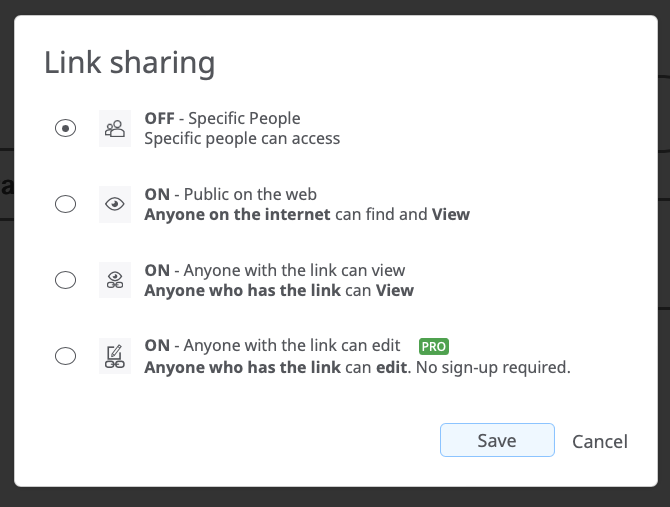
Collaborative mind mapping in Mindomo
Access can be shared by adding other MindomoA sophisticated browser-based application for rapidly recording information and ideas (text, links, images, audio, video, files etc.) and organising it into either a spider-diagram layout with a central topic (mind map) or an interconnected web of topics (concept map). Large amounts of information m... More users, or by sharing a link.
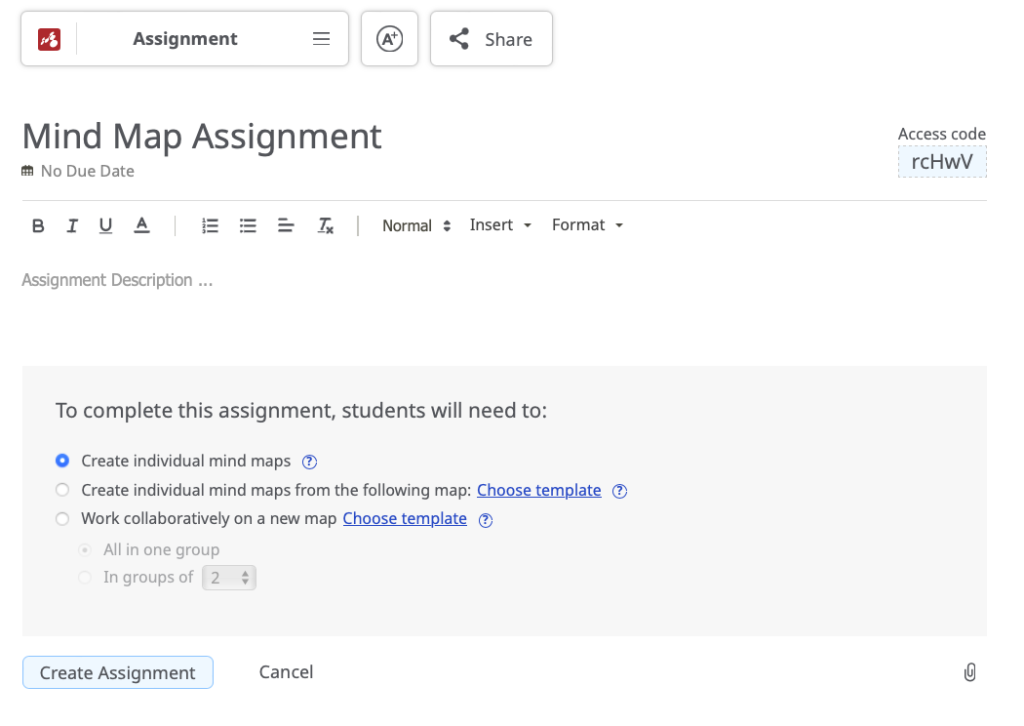
Mindomo for Teaching
This is available with the Teacher Subscription (currently €4.5 a month). Begin by creating a template for the students to complete, then distribute a copy to each student, or a copy to each group of students. Set a deadline. Watch as the students complete the maps. Review and give feedback. It’s even possible to watch an animation of the process the student went through in completing their map.
Leave a Reply